Troubleshooting
This how-to guide explains how to troubleshoot issues when building and testing languages in the Spoofax Eclipse LWB plugin.
Diagnosing problems
Looking for errors
If something is not working as expected, the first thing to check is whether there are errors in the project by looking in the Project Explorer or Package Explorer view, which is open on the left-hand side of the IDE by default. If there are any red markers on the project, or any directory or file in the project, that indicates an error.
When there are errors on files that define your language (e.g., .cfg/.sdf3/.stx/.str2 files), the language is not compiled and reloaded, so building the language has no effect, and your change will not be taken into account. Errors on example and test (e.g., .spt) files are ok, and do not prevent the language from being compiled and reloaded.
It is also possible to get a list of all the errors in the project by opening the Problems view. If this view is not open, open it by choosing Window ‣ Show view ‣ Problems from the main menu.
Consulting the logs
Spoofax logs a lot of information to make troubleshooting easier. First consult the Error Log view. If this view is not open, open it by choosing Window ‣ Show view ‣ Error Log from the main menu.
The error log contains warning and error events from all plugins running in Eclipse, including several Spoofax plugins. Most errors include stack traces, which help the Spoofax developers immensely in bug reports or when asking for help. Browse through the errors from Spoofax plugins to see if it can help you troubleshoot the problem.
If nothing relevant is in the error log, try to consult the Console view. If this view is not open, open it by choosing Window ‣ Show view ‣ Other... ‣ search for Console ‣ choose Console and open it from the main menu.
 If the console view does not say
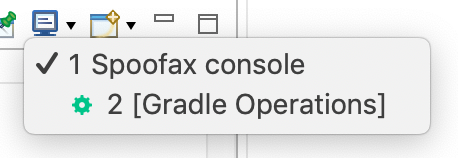
 Spoofax in the top-left corner, ensure the Spoofax console is open by pressing the small downward error on the blue monitor icon and selecting Spoofax console (see screenshot).
Browse through the log from Spoofax plugins to see if it can help you troubleshoot the problem.
When building, Spoofax logs all tasks and files that are checked, and all tasks that are built. At the end of the build, Spoofax logs whether it completed or if something went wrong. Rebuild your language and check the build log to see if it can help you troubleshoot the problem.
If you ask for help or report a bug, consider storing the log in a text file, so you can include it in your help request or bug report.
Problems and solutions
Errors in language definition files
Error markers in language definition files (e.g., .cfg/.sdf3/.stx/.str2 files) are expected. If there are errors on language definition files, solve them build the language.
Errors in generated files
If there are errors in generated files (i.e., files in the build/generated directory), first try to build the language, as building the language may re-generate these files.
If the error persists, try deleting the generated file and then building the language.
Also consider reporting this bug, as we consider incrementality issues like these bugs.
If after deleting the generated file and rebuilding the language, the generated file comes back with errors, definitely report this as a bug. Try to work around the problem first by cleaning the language project or by deleting on-disk cache and restarting Eclipse
Errors occurred during the build
If after building a language, an error popup appears, something unexpected went wrong. Please report this as a bug. Try to work around the problem first by cleaning the language project or by deleting on-disk cache and restarting Eclipse
Many duplicate definition errors/other weird errors
If there are many errors about duplicate definitions, things already being defined, or other weird errors, see if there is a bin directory in your language project.
If so, delete the bin directory and rebuild the project.
Workarounds
Cleaning the language project
Try cleaning the language project by first selecting (clicking) the language project in the Project Explorer or Package Explorer view, and then choosing Project ‣ Clean... from the main menu. In the clean window, deselect Clean all projects, select your project, and press Clean.
Then, rebuild your language.
Optionally, check the error log and console again.
If this does not help, you can try to first delete the build directory, then clean the language project, and then build the project.
If this solves your problem, consider reporting this bug, as we consider incrementality issues like these bugs. If not, try the next workaround.
Deleting on-disk cache and restarting Eclipse
Finally, there may be a problem related to the on-disk cache.
First, close Eclipse.
Then, navigate to your workspace directory and delete the .metadata/.plugins/spoofax.lwb.eclipse/pieStore file.
These directories are hidden, so you may need to enable showing hidden files, or delete the file using your terminal.
Then, start Eclipse again and build your language. Optionally, check the error log and console again.
If this solves your problem, consider reporting this bug, as we consider incrementality issues like these bugs. If not, ask for help.
Report a bug or ask for help
If after troubleshooting the issue is not resolved, report this bug if you think this is a bug, or ask for help.
Advanced troubleshooting
Checking for deadlocks (and making a thread dump)
If Eclipse seems to be stuck, hanging, or not making any progress, check for deadlocks by making a thread dump.
First, we need to figure out the process ID of the JVM that is running eclipse.
Run the jps command in a terminal.
It will print something like:
80035 Jps
94805
74294 org.eclipse.equinox.launcher_1.6.100.v20201223-0822.jar
51515 Eclipse
74236 GradleDaemon
In this case, 51515 is the process ID of Eclipse.
Then run jstack <process-ID>, so jstack 51515 in this case.
jstack prints a thread dump with a stack trace for each thread, alongside any detected deadlocks.
While it may be hard to use this information to troubleshoot yourself, this can be useful information when asking for help or when reporting a bug.
In case of deadlocks, please report this bug.
Checking memory (and making a heap dump)
If Eclipse seems to be using excessive amounts of memory or processor time, check how much heap space Eclipse is using. To show the heap space Eclipse is using, go to the Eclipse preferences, and in the General tab, enable Show heap status. The heap status shows up in the bottom right corner.
Press the trash can icon to run garbage collection, which will free up any available memory. If after garbage collection, the memory is still near its maximum, Eclipse has run out of memory and will become very slow or unresponsive.
To diagnose the problem, first make a thread dump as was described in the previous section. A thread dump may give some clues as to what is generating or leaking heap memory.
Then, make a heap dump by running jmap -dump:live,format=b,file=heap.bin <process-ID> using the process ID of Eclipse, as was described in the previous section.
This creates a heap dump file called heap.bin in the working directory.
This heap dump can then be loaded into a profiler such as VisualVM for inspection.
In case of excessive memory problems, please report this bug and share the heap dump. To share heap dumps, upload them to a cloud service such as Mega and share the link.
Warning
Heap dumps contain all the JVM memory in Eclipse, which can include any information that you have entered into Eclipse. Only share a heap dump if you are sure you have not entered any sensitive information into Eclipse.